


I first heard of the Sahm Rule on a trading podcast earlier this week. When I heard the economic rule mentioned again during today’s Federal Reserve press conference on monetary policy, my ears perked up and my eyes opened wide. Surely this combination and recency was not a coincidence. Financial markets, Wall Street, and pundits must have a new recession obsession in the form of a rule that has a near perfect record of predicting recessions. Conventionally, the Sahm Rule signals the onset of recession when it hits 0.5. As of today, this ominous rule in economics is at 0.43 (using June, 2024 data), its highest level in over 3 years.

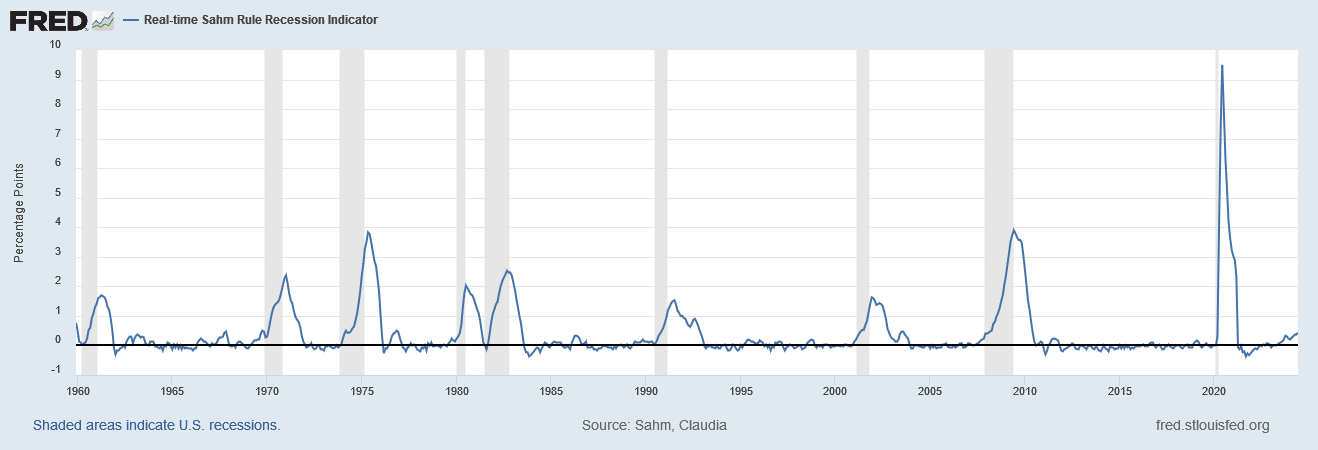
Source: Sahm, Claudia, Real-time Sahm Rule Recession Indicator [SAHMREALTIME], retrieved from FRED, Federal Reserve Bank of St. Louis, July 31, 2024.
The chart above shows the uncanny consistency of the Sahm Rule. Since 1960, the Sahm Rule has had just one false positive (in 2003) and no false negatives. Thus, the persistent and consistent upward trend in the Sahm Rule since October, 2021 all but locks in a recession signal in the coming months.
Powell Downplays Sahm
The question hung in the air for what felt like an comfortable several minutes while Fed Chair Jerome Powell flipped through his notes: “how worried are you about unemployment rising to the point where it triggers the Sahm Rule, and would that potentially affect how quickly you cut rates?” For a while there, I thought the question caught Fed Chair Jerome Powell by surprise. After he stopped flipping his through his notes he responded by first reassuring everyone he is familiar with the Sahm rule. He even explained the implication of the rule – that a severe downturn in employment is imminent. He also clarified that the Sahm Rule is not really a rule with predictive power, it is a “statistical regularity.” In other words, past performance does not guarantee future results. Powell concluded his response by insisting that the labor market is normalizing and remains healthy. He also reminded everyone that a lot of “received [economic] wisdom” has not worked in this post pandemic business cycle, like the predictions of recession based on the inverted yield curve.
What is the Sahm Rule?
The definition of the Sahm Rule is buried in a policy proposal from economist Claudia Sahm. Sahm sought to create an automatic rule for initiating economic relief payments to take the edge off a recession.
“Automatic lump-sum stimulus payments would be made to individuals when the three-month average national unemployment rate rises by at least 0.50 percentage points relative to its low in the previous 12 months.”
The graph provided by the St Louis Federal Reserve calculates the percentage points used in that rule. Clearly, this rule looks like a very good harbinger of recession.
What are the implications of the Sahm Rule?
While history may only rhyme, I strongly suspect the buzz about the Sahm rule will produce a drum beat synchronous with history’s rhyme. The irony is that, for now anyway, Wall Street will welcome increasing fears of a recession as those worries will act like co-signers to a September rate cut. The predicted near certainty of a rate cut initiated a dramatic market rotation favoring a whole host of rate sensitive sectors over growth, big cap tech stocks. That rotation looked ready to take its next logical step as the iShares Russell 2000 ETF (IWM) surged to a new 2-year high. However, the ETF of small caps faded back to a 0.6% gain and failed to confirm the invalidation of a prior blow-off top. Still, I remain patiently bullish on IWM (a short-term IWM calendar call spread hit my initial profit target as IWM surged intraday).

And then there are bond yields. Lower yields should correlate with an intensifying recession obsession. For now, I am sticking to the presumed trading range on iShares 20+ Year Treasury Bond ETF (TLT). TLT closed right at the top of that range. If TLT breaks out, I will draw a new presumed trading range; I still think ballooning U.S. debt levels and persistently strong economic data provide catalysts for downward pressure on TLT. I bought a fresh round of TLT put options near the close on the assumption TLT will have at least one more fade back to some support level.

The latest recession obsession in the form of the Sahm Rule is sure to produce additional trading opportunities…and surprises to come. At a minimum, the Sahm Rule provides dominant context for each month’s latest job report. Next up – this coming Friday.
Be careful out there!
Full disclosure: long IWM shares and calls, long TLT put
The chart seems to indicate that the Sahm rule confirms recessions rather than predicts them; by the time the metric reaches 0.5 the recession is already in progress. Given that, there was a recession around 2002, so how was the nearby Sahm spike a false positive?
You’re looking too closely. The rule just needs to trigger “close enough” to the beginning relative to the duration to serve as a good tool. For comparison, the inverted yield curve rule has a range that varies from 6-12 months for predicting a recession (depending on the economist and pundit). Recall that the NBER doesn’t even declare a recession until after its over. So the reason why 2003 as a false positive is that no recession ever occurred “near” the trigger of the rule. So my question would be to what degree of accuracy do you require for a rule to be sufficiently useful? There is none better than the Sahm Rule in terms of fitting history (I say “fitting” in deference to both Sahm and Powell who insist it is not a predictive tool). I am surprised you want to give the Sahm Rule credit for the recession that ended in 2022 – we’re looking for an indicator that triggers in time to make economic decisions (as Sahm was doing).
For quibbles, you can use Powell’s term, the Sahm Rule has “statistical regularity”, aka, it is highly correlated with the onset of a recession.